
The perfect stress test for democracy’s worst case scenario…
Why the “70 % haven’t seen a voter guide” during early voting finding hits even harder once you look at San Antonio’s population churn…

Nearly 70 % had never seen a non-partisan voter guide before—during early voting—underscoring the information gap our project fills.
1. The city is pulling in a lot of brand-new residents—exactly the people least likely to be plugged-in
San Antonio has been the country’s biggest population gainer more than once—most recently between July 2022 and July 2023, when it added about 22 000 residents and reclaimed the No. 1 spot. In the newest 2024 estimates it’s still growing briskly (+24 000) and was only passed by New York, Houston and Los Angeles.
Using the most recent migration micro-data and local studies, the typical newcomer to San Antonio is roughly 31 – 33 years old, a few years younger than the city’s overall median age (34.6)
Why newcomers skew youngJobs & affordability. San Antonio’s cost of living is lower than other large Texas metros, so early-career workers and first-time buyers can stretch paychecks further.
Military & higher-ed pipelines. Joint Base San Antonio brings in service members in their 20-30s, and UTSA adds a constant flow of graduates who stay.
Family formation phase. The city’s new-construction boom (starter homes on the fringes, urban infill downtown) meshes with life-stage needs of people in their late 20s and early 30s.
2. Movers routinely vote less—and lack of trusted information is a key reason
Peer-reviewed studies find that residential mobility depresses turnout for years, mainly because social ties and local knowledge get severed each time people move. ResearchGate
3. San Antonio’s turnout problem is already glaring
In the 2025 municipal election only 5.8 % of registered voters showed up during early voting—a modern low. KSAT Total Bexar County turnout on May 3 was just below 10%—about half the last city election. With so few voters showing up, each informed ballot carries outsized weight.
4. Put the numbers together and the 70 % gap becomes a five-alarm fire
70 % of surveyed voters said they hadn’t seen any non-partisan voter information. There is a massive information desert right where new and undecided voters are looking.
Tens of thousands of newcomers arrive each year, most in their early 30s. The “desert” is growing: every year another tranche of voters arrives with no party contacts, no local media habits, and no idea who’s on the ballot and no idea where to look.
Mobility saps turnout for years unless the info gap is bridged A single neutral voter guide can short-circuit that drop-off by lowering the “learning costs” that come with a new address.
5. Why this should move funders, partners, and election officials
Compounding impact. Every guide you send today doesn’t just help one election; it can establish a voting habit for a newcomer who might otherwise sit out multiple cycles.
Equity lens. New arrivals are disproportionately renters, students, people of color, and mid-income workers—groups already under-represented at the polls. Filling the info gap closes more than one participation divide at once.
Scalability. Because San Antonio is the country’s top numeric grower, solutions proven here can translate to Houston, Phoenix-style boomtowns, and the dozen Texas suburbs posting double-digit growth rates.
Cost-effectiveness. Compared with partisan outreach (which ignores unaffiliated newcomers) or large-scale GOTV canvassing, a concise, non-partisan guide is cheap, scalable, and trusted across the political spectrum.
Bottom line
The 70 % “never saw a guide” statistic isn’t just a missing-information problem—it’s a fast-growing missing-information problem fueled by San Antonio’s unprecedented inflow of young adults. If we don’t flood that desert with clear, neutral voter information now, today’s gap will be even wider by the next election. Conversely, every dollar spent on non-partisan guides in San Antonio delivers a double dividend: higher turnout and a durable fix for the mobility-driven participation slump that boomtowns across Texas are already grappling with.

2025 Texas Voter Project — May 3 Results

1. Executive summary
425 San Antonians (ages 18-35) completed our post-election survey.
81 % rated the guide “Very” or “Extremely” useful.
92.7 % want the guide every election.
Helpfulness held across ideology:
79 % right-leaning
82.6 % moderate
85.9 % left-leaning
64.8 % “unsure”/no label
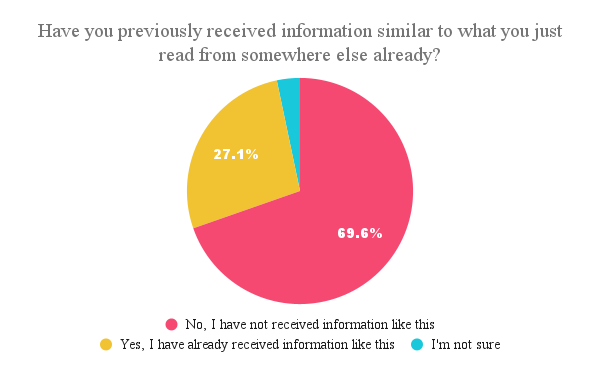
69.6 % had never received election info like this before.
“I wish the mayoral link had a graph or chart with a quick breakdown on major issues by candidate, and the issue they find most important” – female, leans liberal
“It doesn't really elaborate on anything to do with these candidates. I'd like information on what their platforms are, or at least a link to their social media or website.” – male, leans conservative
2. Why this really matters
Turnout cratered. May 3 turnout was < 10 % (only 5.8 % in early vote), so each informed ballot speaks for 10 others.
Young newcomers dominate growth. SA gains ~24 k people a year, most ~31-year-old renters/grads with zero local contacts.
Mobility kills voting. Moving slashes turnout 5-8 pts for years unless newcomers get trusted info.
Info desert confirmed. 69 % of our 425 qualified respondents had never seen a non-partisan guide before ours.
Five-alarm fire. Low-info newcomers + rock-bottom turnout = city policy set by a tiny, aging electorate.
State & national ripple. Plugging the gap in Bexar lifts 2026 statewide turnout and nudges Texas’ 40 EVs in 2028.
Cheap, scalable fix. One neutral digital guide costs pennies, travels anywhere Texas is booming, and seeds long-term voting habits.
Bottom line: San Antonio’s growth isn’t a civic win until its newest residents actually vote—and a simple, non-partisan guide is the fastest way to make that happen.
3. Methodology
We drew a random sample of 625 registered voters aged 18‑35 from Bexar County. Each person received one piece of outreach: a mobile‑first, interactive PDF voter guide about the May 2025 San Antonio mayor’s race. The guide was embedded directly in the email and packed with live links to trusted third‑party resources—like the Bexar County Elections portal—so readers could dive into polling‑place details, registration look‑ups, and candidate filings with a single tap. There were no follow‑up texts, postcards, or calls, so we could isolate the guide’s impact.
After reading, recipients landed on an embedded Qualtrics survey with eight substantive questions:
How useful was the guide?
Had they previously received similar non‑partisan information this cycle?
Was the content easy to understand?
Would it be helpful to get information like this for future elections?
Open‑ended: anything they didn’t like?
Attention‑check item (agree/disagree split) to weed out speed‑clickers.
Education level.
Political ideology.
Standard demographics (race, ethnicity, sex) were optional and collected only for internal crosstab analysis—not featured in headline numbers.
Out of a total 625 respondents 425 (68 % of the sample) completed the survey and confirmed they live inside San Antonio city limits.
4. Detailed findings
4.1 Usefulness distribution

Key takeaway: 81 % rated the guide “Very” or “Extremely” useful.
4.2 Demand for future guides

Key takeaway: 92.7 % want the guide every election.
4.3 First-time exposure

Key takeaway: Nearly 70 % had never seen a non-partisan voter guide before, during early voting, underscoring the information gap our project fills.
4.4 Cross-ideological appeal

Key takeaway: rated as extremely/very useful across the ideological spectrum.
4.5 What voters want next
Out of 108 open-ended comments, nearly half (42 %) simply said the guide was great as-is, while about a third (35 %) asked for more detail—typically longer candidate bios or deeper issue links. The remaining 23 % fell into an “other” grab-bag of notes (everything from typos to “please make a dark-mode PDF”). In other words, most young readers either loved the guide outright or wanted the very thing we’re planning next: richer drill-down content—good news for iteration.
5. Interpreting the numbers
Information deserts are real. Seven in ten young voters lack basic election info until it’s handed to them.
Non-partisanship wins trust. Uptake was high even among voters who normally avoid “political” content.
Low turnout amplifies impact. In a sub-10 % election, shifting just a few thousand young voters could alter outcomes.
6. What’s next — June 7 Runoff Guide 2.0
Voters asked for side-by-side candidate snapshots, so we’re sprinting to deliver:
Cost: Research, fact-check, bilingual design $5,000 + survey $8 per voter
Early voting: May 27 – June 3
Funding deadline: May 27 (to hit inboxes on time)
7. How you can help
Every $80 gets the upgraded guide and a reminder text to 10 under-35 voters.
Every $5,000 covers full production.
www.TexasVoterProject.org/runoff
Questions about the data? Want the raw anonymized dataset?
Email sophia@texasvoterproject.org and we’ll gladly share.

Breaking New Ground: A First-of-Its-Kind Study on Youth Voting
Breaking New Ground: A First-of-Its-Kind Study on Youth Voting

RESEARCH PROPOSAL
Project Title: Evaluating the Impact of Nonpartisan Voter Guides on Youth Voter Turnout in San Antonio, Texas
Overview: The Texas Voter Project (TVP) is conducting a research-driven initiative to assess the effectiveness of nonpartisan, bilingual voter guides in increasing voter turnout among young registered voters (ages 18–35) in San Antonio. This study will provide empirical data on whether direct election education influences participation and can serve as a model for future civic engagement efforts.
Research Objectives:
Determine the impact of voter guides on turnout by comparing treatment and control groups.
Assess voter guide effectiveness through a survey measuring awareness, usefulness, and motivation to vote.
Generate actionable insights for future voter education programs based on turnout data and survey responses.
Methodology:
1. Voter File Access & Randomization
TVP will independently access the Bexar county voter file to obtain an accurate list of registered voters aged 18–35 in San Antonio, Texas.
TVP will apply proper randomization techniques to divide participants into:
Treatment Group (receives the voter guide).
Control Group (does not receive the voter guide).
2. Voter Guide Mailing
Depending on funding, between 50,000 and 300,000 bilingual (English/Spanish) nonpartisan voter guides will be printed and mailed.
Guides will include election deadlines, voting methods, and a QR code linking to an interactive voter tool.
Mailing will take place 3 weeks before Election Day (May 3, 2025) to maximize engagement.
3. Turnout Analysis
After the election, TVP will use updated voter file data to compare turnout rates between the treatment and control groups.
Data from online tools will be analyzed to identify patterns in turnout based on demographics, language, and engagement levels.
Projected Impact Based on Funding Levels:
$50,000 – Foundational Impact
50,000 voter guides mailed + a randomized control group.
Basic online survey to measure effectiveness.
Limited turnout analysis comparing treatment and control groups.
$125,000 – Measurable Expansion
125,000 voter guides mailed + a randomized control group.
Expanded targeted survey with deeper demographic insights.
Stronger turnout analysis in collaboration with UTSA & UTA researchers.
$200,000 – Gold Standard Research Study
300,000 voter guides mailed + a professionally randomized control group.
Comprehensive turnout analysis measuring impact across demographic and language groups.
Fully developed comprehensive digital voter education tool.
Robust post-election survey with extensive data collection on voter behavior.

Expected Outcomes & Impact:
Foundational Evidence: This study will provide statistically valid data on the effectiveness of voter guides in increasing turnout.
Scalability & Replication: Findings can inform similar efforts across Texas and nationwide.
Long-Term Civic Engagement: Understanding voter behavior can help shape future strategies for mobilizing young and underrepresented voters.
Call for Support:
We are seeking full or partial funding to execute this research study. Each $0.63 donation sends one voter guide, directly impacting youth voter participation. By supporting this project, funders will contribute to a data-driven solution for increasing youth civic engagement in Texas and beyond.
For more information, please contact:
Sophia DeLoretto-Chudy
Executive Director
Texas Voter Project
info@texasvoterproject.org